All Prompts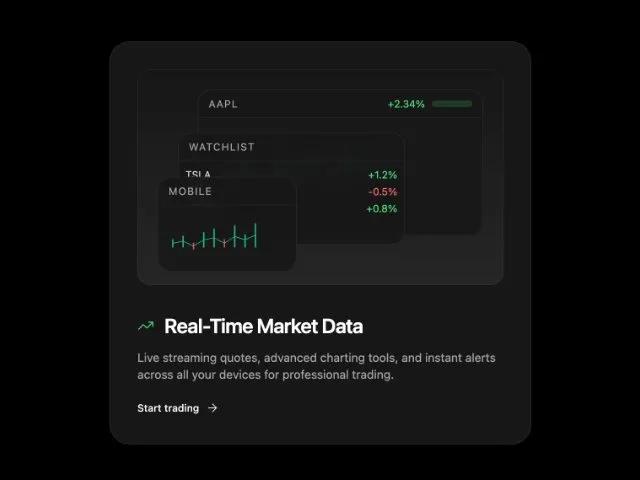 All Prompts
carddashboardtailwindchartfinanceresponsivehoverwidget
Trading Dashboard Card with Real-Time Market Data
Карточка дашборда для трейдинга с UI Tailwind CSS. Отображает график, портфель, превью. Для финансовых виджетов и платформ.
Prompt
<article class="group relative overflow-hidden transition-shadow hover:shadow-md bg-neutral-900 border-neutral-800 border rounded-3xl shadow-sm max-w-[500px]">
          <div class="sm:p-8 px-6 py-6">
            <!-- Illustration -->
            <div class="relative h-56 sm:h-64 rounded-2xl bg-gradient-to-b from-neutral-900 to-neutral-800 ring-1 ring-inset ring-white/5">
              <!-- Main trading chart -->
              <div class="absolute right-3 sm:right-6 top-4 sm:top-6 w-[78%] h-[68%] rounded-2xl bg-neutral-900/90 backdrop-blur border border-neutral-800 shadow-sm">
                <div class="flex items-center justify-between px-3 py-2 border-b border-neutral-800/70">
                  <span class="text-[10px] sm:text-xs tracking-widest text-neutral-400">AAPL</span>
                  <div class="flex items-center gap-2">
                    <span class="text-xs text-green-400">+2.34%</span>
                    <span class="h-2 w-12 rounded bg-green-500/20"></span>
                  </div>
                </div>
                <div class="p-2">
                  <svg viewBox="0 0 300 90" class="w-full h-20 sm:h-24 text-neutral-700">
                    <defs>
                      <pattern id="dots1" x="0" y="0" width="4" height="4" patternUnits="userSpaceOnUse">
                        <circle cx="1" cy="1" r="0.5" fill="currentColor" opacity="0.3"></circle>
                      </pattern>
                    </defs>
                    <rect width="100%" height="100%" fill="url(#dots1)"></rect>
                    <!-- Candlestick-style bars -->
                    <rect x="20" y="45" width="3" height="20" fill="#EF4444"></rect>
                    <rect x="40" y="35" width="3" height="25" fill="#10B981"></rect>
                    <rect x="60" y="50" width="3" height="15" fill="#EF4444"></rect>
                    <rect x="80" y="30" width="3" height="30" fill="#10B981"></rect>
                    <rect x="100" y="40" width="3" height="20" fill="#10B981"></rect>
                    <rect x="120" y="25" width="3" height="35" fill="#10B981"></rect>
                    <rect x="140" y="45" width="3" height="18" fill="#EF4444"></rect>
                    <rect x="160" y="20" width="3" height="40" fill="#10B981"></rect>
                    <rect x="180" y="35" width="3" height="25" fill="#10B981"></rect>
                    <rect x="200" y="15" width="3" height="45" fill="#10B981"></rect>
                    <polyline points="22,55 42,47 62,57 82,45 102,50 122,42 142,54 162,40 182,47 202,37" fill="none" stroke="#10B981" stroke-width="1.5" stroke-linecap="round"></polyline>
                  </svg>
                </div>
              </div>

              <!-- Watchlist -->
              <div class="absolute left-6 sm:left-12 bottom-10 sm:bottom-12 w-[62%] h-[52%] rounded-2xl bg-neutral-900/90 backdrop-blur border border-neutral-800 shadow-sm">
                <div class="flex items-center justify-between px-3 py-2 border-b border-neutral-800/70">
                  <span class="text-[10px] sm:text-xs tracking-widest text-neutral-400">WATCHLIST</span>
                </div>
                <div class="p-2 space-y-1">
                  <div class="flex items-center justify-between text-xs">
                    <span class="text-neutral-300">TSLA</span>
                    <span class="text-green-400">+1.2%</span>
                  </div>
                  <div class="flex items-center justify-between text-xs">
                    <span class="text-neutral-300">MSFT</span>
                    <span class="text-red-400">-0.5%</span>
                  </div>
                  <div class="flex items-center justify-between text-xs">
                    <span class="text-neutral-300">GOOGL</span>
                    <span class="text-green-400">+0.8%</span>
                  </div>
                </div>
              </div>

              <!-- Mobile view -->
              <div class="absolute left-3 sm:left-6 bottom-3 sm:bottom-4 w-[38%] h-[44%] rounded-2xl bg-neutral-900/90 backdrop-blur border border-neutral-800 shadow-sm">
                <div class="flex items-center justify-between px-3 py-2 border-b border-neutral-800/70">
                  <span class="text-[10px] sm:text-xs tracking-widest text-neutral-400">MOBILE</span>
                </div>
                <div class="p-2">
                  <svg viewBox="0 0 180 70" class="w-full h-14 sm:h-16 text-neutral-700">
                    <rect x="10" y="35" width="2" height="12" fill="#10B981"></rect>
                    <rect x="25" y="30" width="2" height="17" fill="#10B981"></rect>
                    <rect x="40" y="40" width="2" height="10" fill="#EF4444"></rect>
                    <rect x="55" y="25" width="2" height="22" fill="#10B981"></rect>
                    <rect x="70" y="20" width="2" height="27" fill="#10B981"></rect>
                    <rect x="85" y="35" width="2" height="12" fill="#EF4444"></rect>
                    <rect x="100" y="15" width="2" height="32" fill="#10B981"></rect>
                    <rect x="115" y="28" width="2" height="19" fill="#10B981"></rect>
                    <rect x="130" y="12" width="2" height="35" fill="#10B981"></rect>
                    <polyline points="11,41 26,38 41,45 56,36 71,33 86,41 101,31 116,36 131,29" fill="none" stroke="#10B981" stroke-width="1" stroke-linecap="round"></polyline>
                  </svg>
                </div>
              </div>
            </div>

            <!-- Content -->
            <div class="mt-6 sm:mt-8">
              <div class="flex items-center gap-3">
                <svg xmlns="http://www.w3.org/2000/svg" width="24" height="24" viewBox="0 0 24 24" fill="none" stroke="currentColor" stroke-width="1.5" stroke-linecap="round" stroke-linejoin="round" data-lucide="trending-up" class="lucide lucide-trending-up h-5 w-5 text-green-400"><path d="M16 7h6v6"></path><path d="m22 7-8.5 8.5-5-5L2 17"></path></svg>
                <h3 class="text-xl sm:text-2xl font-semibold tracking-tight text-white">Real‑Time Market Data</h3>
              </div>
              <p class="mt-3 text-neutral-400 text-sm">Live streaming quotes, advanced charting tools, and instant alerts across all your devices for professional trading.</p>
              <div class="mt-4">
                <a href="#" class="inline-flex items-center gap-2 text-xs font-medium text-neutral-100 hover:text-neutral-300" title="Link disabled in preview mode">
                  Start trading
                  <svg xmlns="http://www.w3.org/2000/svg" width="24" height="24" viewBox="0 0 24 24" fill="none" stroke="currentColor" stroke-width="1.5" stroke-linecap="round" stroke-linejoin="round" data-lucide="arrow-right" class="lucide lucide-arrow-right h-4 w-4"><path d="M5 12h14"></path><path d="m12 5 7 7-7 7"></path></svg>
                </a>
              </div>
            </div>
          </div>
        </article>